7.2. Model
Behavior
Two
major characteristics of the behavior of Leslie model:
These
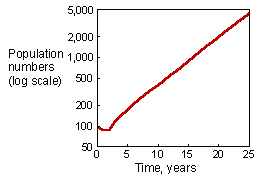
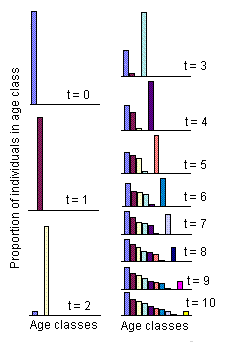
2 features can be seen in the graphs that show simulations of sheep
population dynamics:
In this simulation we started from a population of 100 new-born sheep:
The first graph shows exponential population growth (it becomes linear in a log scale) after several initial years. The second graph shows convergence of age distribution to a stable age distribution. Here is an example of the model of Leslie implemented using Excel spreadsheet:
You can play with this model by changing model parameters (the matrix) and initial age-distribution. You can simplify the analysis of matrix models using PopTools, which is a free Excel plugin developed by Greg Hood, CSIRO, Canberra, Australia. |
Alexei Sharov
1/12/96


