Lab VI: Image
Segmentation Preliminaries in ENVI
Last Updated: 2/19/2013
Note that I have
already done EVERYTHING listed below for you.
I have included this file just to give provide instructions in case you want
to repeat this for a different part of the image at some point in the future as
part of an independent project.
Outline
of the document (Click on links to jump to a section below):
Step1: Getting data out of ENVI - Creating a
TIFF file
Step 2: Import TIFF and create file for use by SPRING
Step 1: Getting data out of ENVI; Create a TIFF file.
Get yourself a copy of wwu2004cir_1m_utm.img. From the ENVI main menu, go to File-Open Image File and select this file. Also from the ENVI main menu bar, go to File-Save File As-TIFF/GeoTIFF. In the Output to TIFF/GeoTIFF Input Filename dialog box, select “wwu2004cir_1m_utm.img” and then click OK. In the Output File to TIFF/GeoTIFF dialog box, select an output folder and filename, then click OK. This will create a *.tif file (containing the image) and a *.tfw file (tiff world file containing some coordinate information).
Go to the output folder you specified and confirm that your tiff file now exists.
Step 2: Use IMPIMA to import your TIFF file and create a .spg (Note that v5.0.4 created a .grb file; v5.1.3 seems to create a .spg file instead; not sure what the difference is). SPRING actually consists of a set of three programs:
SPRING – the image processing and GIS package;
IMPIMA – for image import and export;
SCARTA – for generating and printing maps (we will not be using this package).
We need to begin by using IMPIMA to bring our TIFF file into a format called GRIB that is used by SPRING.
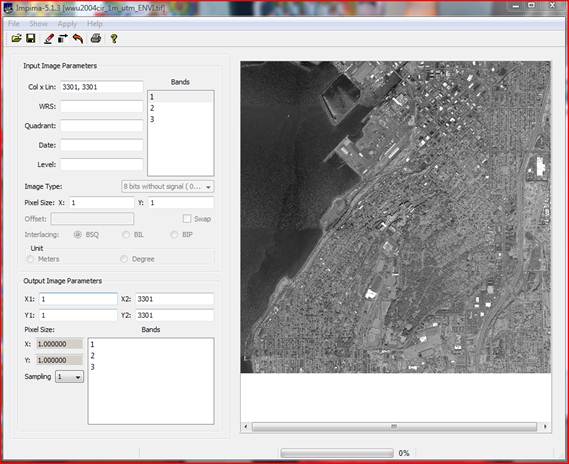
Begin by starting the IMPIMA-5.2 software. From the main toolbar, go to File-Open and select your TIFF file. Assorted file parameters will now be visible in the Input Image Parameters section including:
Col x Lin: 3301, 3301 (this is the number of columns and lines in the file)
ResX: 1.00 ResY: 1.00 (this is the pixel size: 1m by 1m)
Highlight one of the Bands in the Input Image Parameters section and then go to Apply-Draw or push ![]() .
.
In the Output Image
Parameters section, click on all 3 bands and change the Sampling to 1. This will retain the same 1m by 1m pixel size
in the output image. Now go to File-Save As or push ![]() and select a destination and output
filename. Two output files will be
created; one small file with a *.dsc extension and another much large file
(about the same size as your *.tiff file) with a *.spg extension. While these files are being created, the programs provides no feedback to indicate progress and the
task manager indicates that IMPIMA is “not responding.” Be patient!
and select a destination and output
filename. Two output files will be
created; one small file with a *.dsc extension and another much large file
(about the same size as your *.tiff file) with a *.spg extension. While these files are being created, the programs provides no feedback to indicate progress and the
task manager indicates that IMPIMA is “not responding.” Be patient!
After your output files are generated, go to File-exit to close IMPIMA.
Step 3: Open your file in SPRING. Start the SPRING-5.2 software. After closing the “News” panel, (and possibly a warning about Drive Support on 64 bit environments) the initial window looks like this:
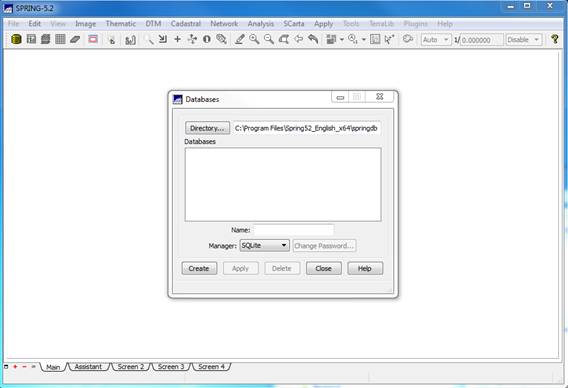
Create a SPRING Database: We need to begin by creating something called a SPRING Database. My working folder for this lab is c:/temp/wallin13/segwwu. I have placed my wwu2004cir_1m_utm.img, wwu2004cir_1m_utm.tif, wwu2004cir_1m_utm.spg and wwu2004cir_1m_utm.dsc files in this folder. Under segwwu, I have created another folder which I called springdb. This is where my SPRING database will reside. From the Databases dialog box, Click on Directory and navigate to the springdb folder (mine is c:/temp/wallin13/segwwu/springdb). Enter a name for your database (I used “wwu_db”) and select “SQLite” as the database type (this is called the “Manager” for some reason).
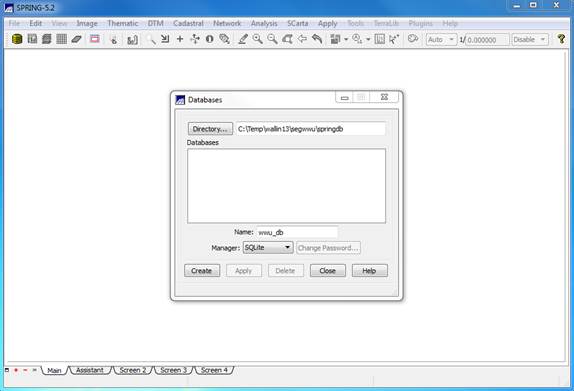
Click Create. If asked if you want this database to have a password, select No. Finally, click on Apply in the Databases dialog box. The dialog box will disappear.
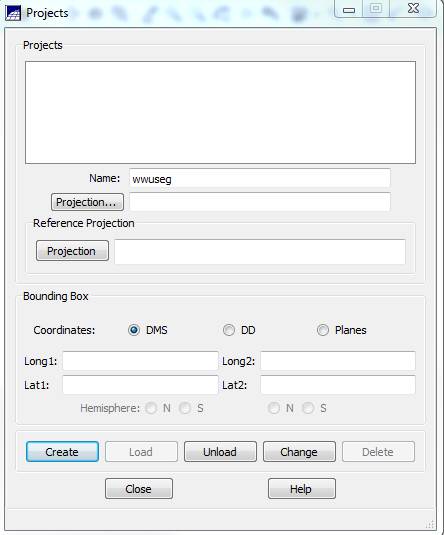
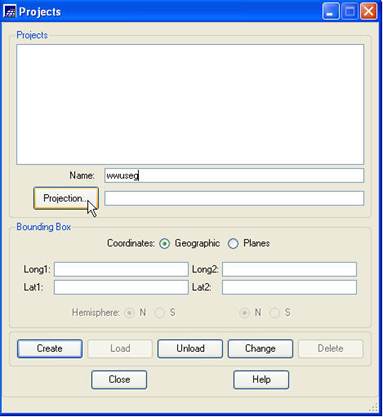
Create a SPRING Project: The SPRING Project defines the projection and bounding box (location and spatial extent) of your image. From the main SPRING toolbar, go to File-Project-Project. From the Projects dialog box, enter a Name (I used wwuseg), then click on the upper Projection button.
In the Projections dialog box enter:
Systems: UTM
Earth Models: Ellipsoid->Clarke-1866
Origin
Long: w 123 0 0.00 (note that the format here is very important; pay attention to spaces)
Zone: 10
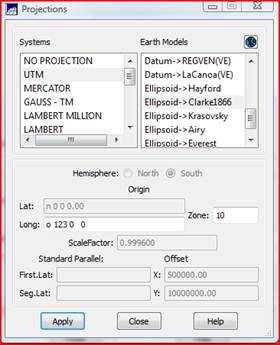
then Apply and
the Projections dialog box will
disappear.
Back in the Projects dialog box, set the Coordinates checkbox to Planes (to enable us to use UTM coordinate rather than latitude/longitude) ((Note: If I click on Geographic here instead of Planes, I can enter lat/long instead and I think ENVI easily gives lat/long for all 4 corners; need to check this)) and enter the coordinates of the lower left (x1, y1) and upper right (x2, y2) of your image. These can be obtained in ENVI by opening your starting image file (wwu2004cir_1m.img). In the Available Bands List dialog, right-click on the image and go to Edit Header. In the Header Info dialog box, note the number of samples (e.g. columns) and lines (e.g. rows) in the image. Now go to Edit Attributes-Map Info. Under Map Coordinate of Tie Point you can obtain the UTM coordinates of the CENTER of the pixel in upper UPPER LEFT corner of the image. It should look like this:
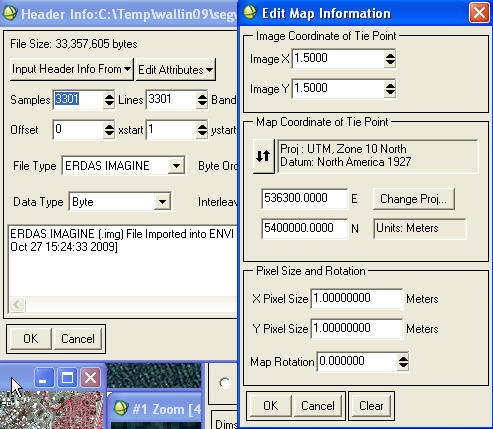
Unfortunately, SPRING needs the coordinates of the LOWER LEFT AND UPPER RIGHT! Like this:
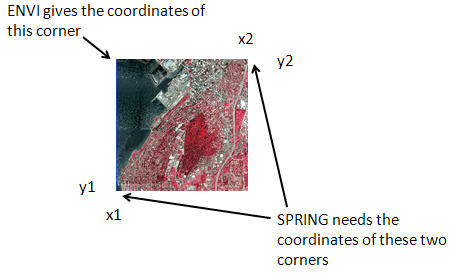
Although it is not entirely clear to me, I think that the coordinate given by ENVI above represents the CENTER of the pixel in the upper left corner of the image. Similarly, although it is not clear, I think that SPRING also needs the coordinates of the CENTER of the pixels in the lower left and upper right corners. So, I have calculated the inputs for SPRING as:
X1 = 536300
Y1 = 5400000 – (3301 -1) = 5396700
X2 = 536300 + (3301-1) = 539600
Y2 = 5400000
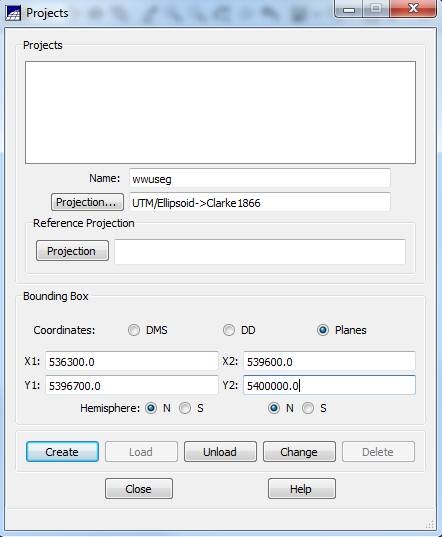
Select the Northern Hemisphere (BOTH PLACES!!!). Then click on Create, then Load.
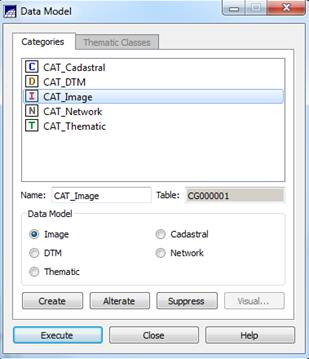
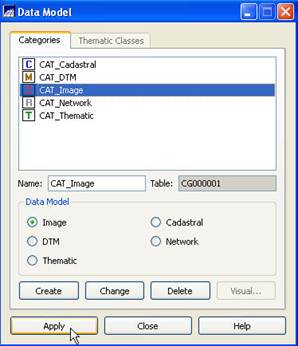
Create a Data Model: From
the main SPRING toolbar, select File-Data
Model. From the Data Model dialog box, under Categories
select the CAT_Image. Then click on ExecuteApply and Close. It will appear as if
nothing has happened. Trust me, all is
well.
5.2
Old
Import the image
(finally!): ((Note: Here is where things begin to go wrong. The 5.1.3 interface is different. Under File-Import, you have the option to
“Import a Registrated Image” but there is no option to import a TIFF. If you use this option, you quickly run into
problems)))
Import the image
(finally!): From the main SPRING
toolbar, select File-Import-Import Registrated (sic) Image.
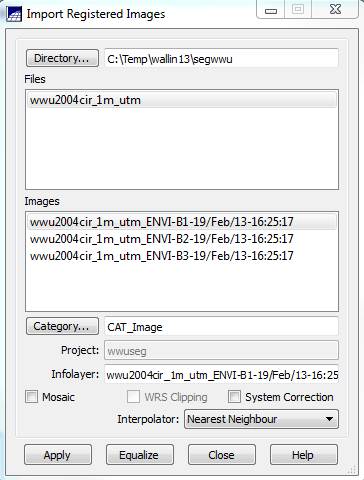
This brings up the Import
Registered Images dialog box.
Initially, you will probably get a waring
indicating that:
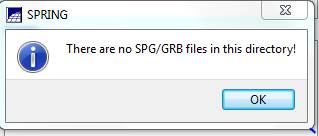
Click OK and then Click on the Directory button and navigate to the folder containing your .spg file (the .spg file was created from the .tiff file in IMPIMA). In my case, this is C:/Temp/wallin13/segwwu. Your .spg file will show up in the Files window and the individual bands will show up in the Images window.
It is not entirely clear to me but it appears that the
layers in the Images window come
from the .tiff file rather than from the .spg
file. At any rate, click on the first
band (wwu2004cir_1m_utm_ENVI-B1-19/Feb/13-16:25:17 in my case) and, next to the
Category button, make sure that it
is set to CAT_Image.
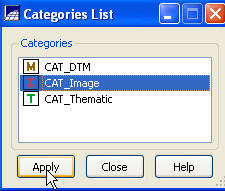
If it isn’t click on the Category button to bring up the Category List dialog box.
Select CAT_Image,
and Apply
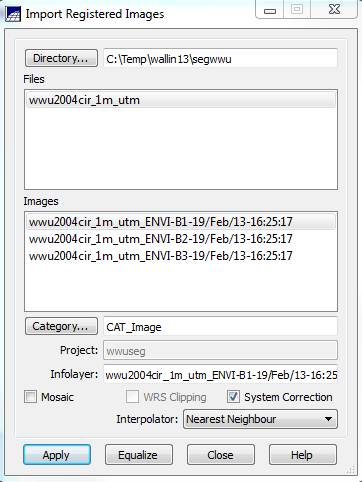
Back in the Import
Registered Images dialog box, click on the System Correction box, leave the Interpolator set to “Nearest
Neighbor,” then click on Apply.
A box will pop up informing you that you have an “Image
without control points!” Click OK to
dismiss this window. Another window may
pop up informing you that you have an “Invalid threshold.” Click OK to dismiss this window. I have no idea what these messages really
mean. At any rate, at this point, your
first band should not appear in the Available
Infolayers window of the Control Panel.
Back in the Import
Registered Images dialog box, repeat this process for your other
bands. Then close the Import Registered Images dialog. After doing this for all 3 bands, go ahead
and Close the Import Registered
Images dialog box.
(((Information below
is unmodified from the procedure that I followed for SPRING 5.0.4)))
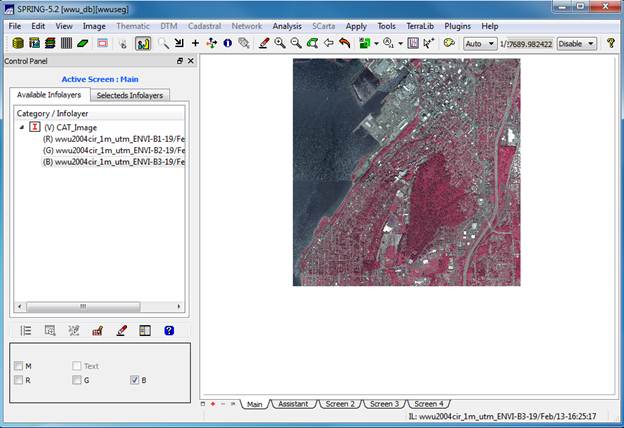
View your image (finally!): Open
the Control Panel. Under the Available Infolayers section of the Control Panel, you will see a list of
all the bands in the image, wwu2004_....B1, wwu2004_...B2, wwu2004_....B3. Highlight wwu2004_1 (recall that this is the near-IR
band; see the tech specs at the beginning of this lab), then click on the R checkbox. This will load band 1 into the red color
gun. Then load wwu 2004_2 (recall that
this is the red band) in the green color gun (G checkbox) and finally wwu2004_3 (recall that this is the green
band) in the blue color gun (B
checkbox). Now click on the drawing
button ![]() .
Your image should appear in the main SPRING window.
.
Your image should appear in the main SPRING window.
How about that! OK, I know this was seems like a ton of work just to display an image. I don’t know why they make it this hard but they do. I told you that the learning curve on SPRING was steep! Trust me, the segmentation and classification part of SPRING will be easier.
If the image doesn’t fill up the SPRING display window, you
might try clicking on the Zoom to Infolayer button ![]() . If you’d like, you can spend some time playing
around with the other zoom functions but let’s move on.
. If you’d like, you can spend some time playing
around with the other zoom functions but let’s move on.
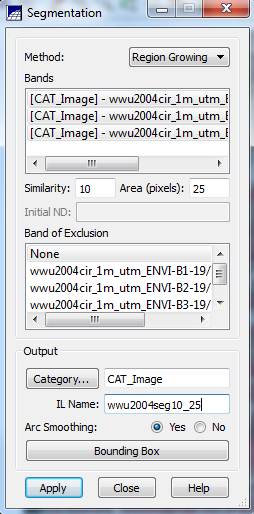
Step 4: Image Segmentation. From
the main SPRING toolbar, go to Image-Segmentation
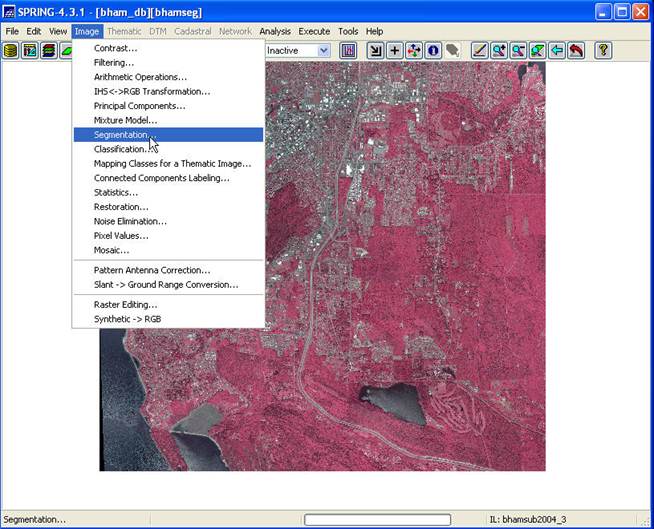
In the Segmentation dialog box, highlight all 3 bands (in the Bands box at the top of the dialog box) by clicking on them one at a time, set the Method box to Region Growing, set the Similarity box to 10 and the Area(pixels): box to 25. This Areas(pixels) sets the smallest region (polygon) that will be delineated in the image. Since we have 1m by 1m pixels, a polygon that has 25 pixels will be 5 m by 5m or 25 m2 ; hence our minimum mapping unit is 25 m2 . In the Output window, leave the Category set to “CAT_Image and in the “IL Name” box, enter an output filename; something like “wwu2004seg10_25” might be good. This indicates a segmented image with a similarity of 10 and a minimum region size of 25 pixels. Set the Arc Smoothing checkbox to yes and click on Apply.
Depending on the size of your processor, this may take minutes to hours to run. Be patient? Go take a break. When the segmentation is finished, you will get a message like this:
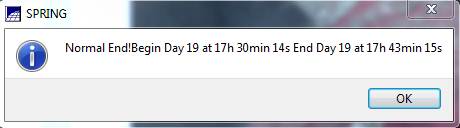
As you can see, this took about 13 minutes on my computer.
Return to Image Segmentation Lab